

GPT vs Claude in analyzing tweets (part 1)

A most nerve-wracking PM interview question

Self-hosting LLMs is actually easy

Tax implications on different ways to a million

Basic Product Manager interview template

Some contradictions of hybrid back to work
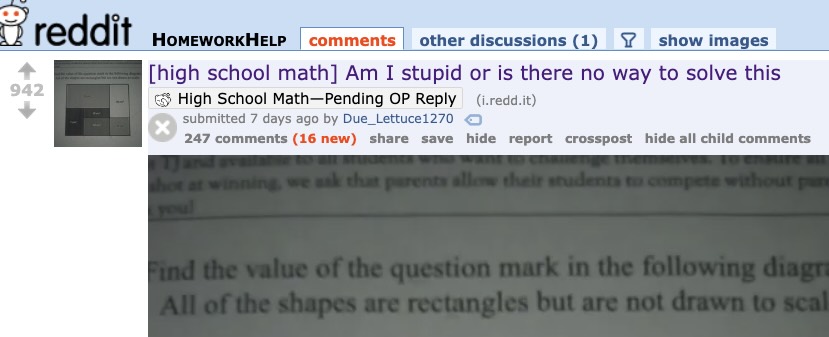
Ode to a good word problem

Fifty Inventions that Shaped the Modern Economy: Mini book Report

My Last Listen at PagerDuty

Don’t tell me you’re working on “Technical Debt”

Get your FAQs from your users
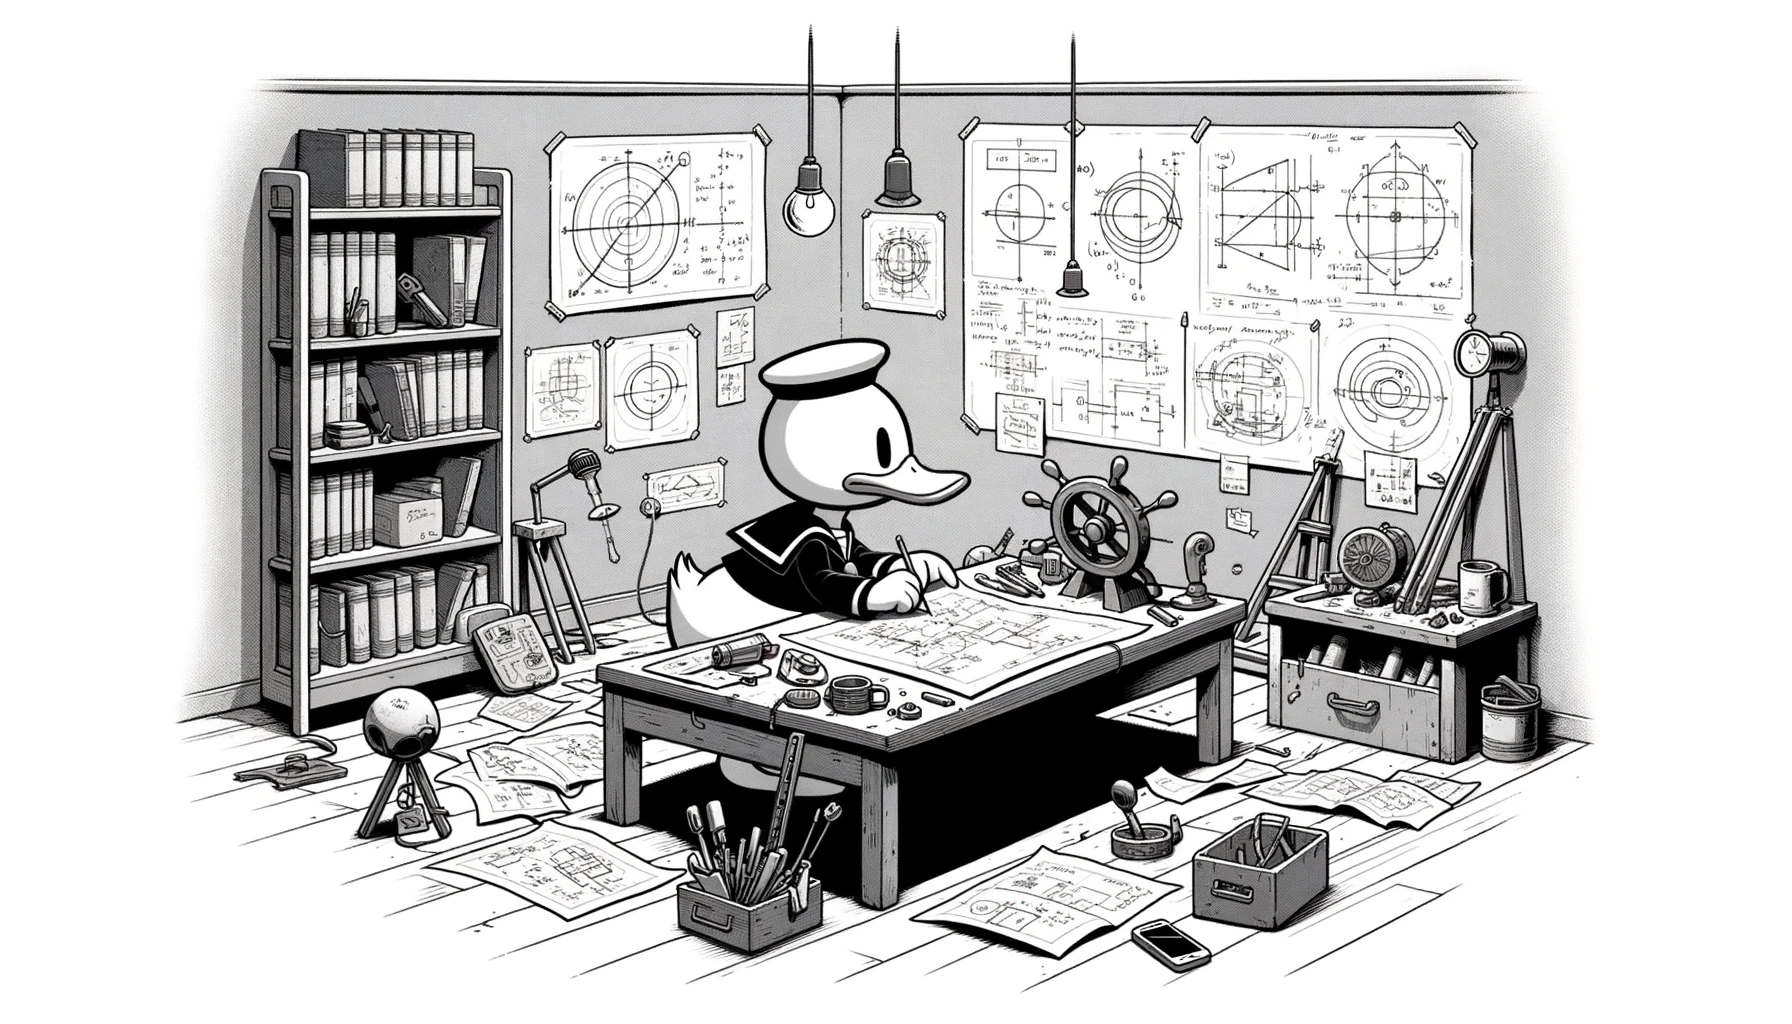
XKCD is the new Donald Duck
Reddit's best nerd jokes

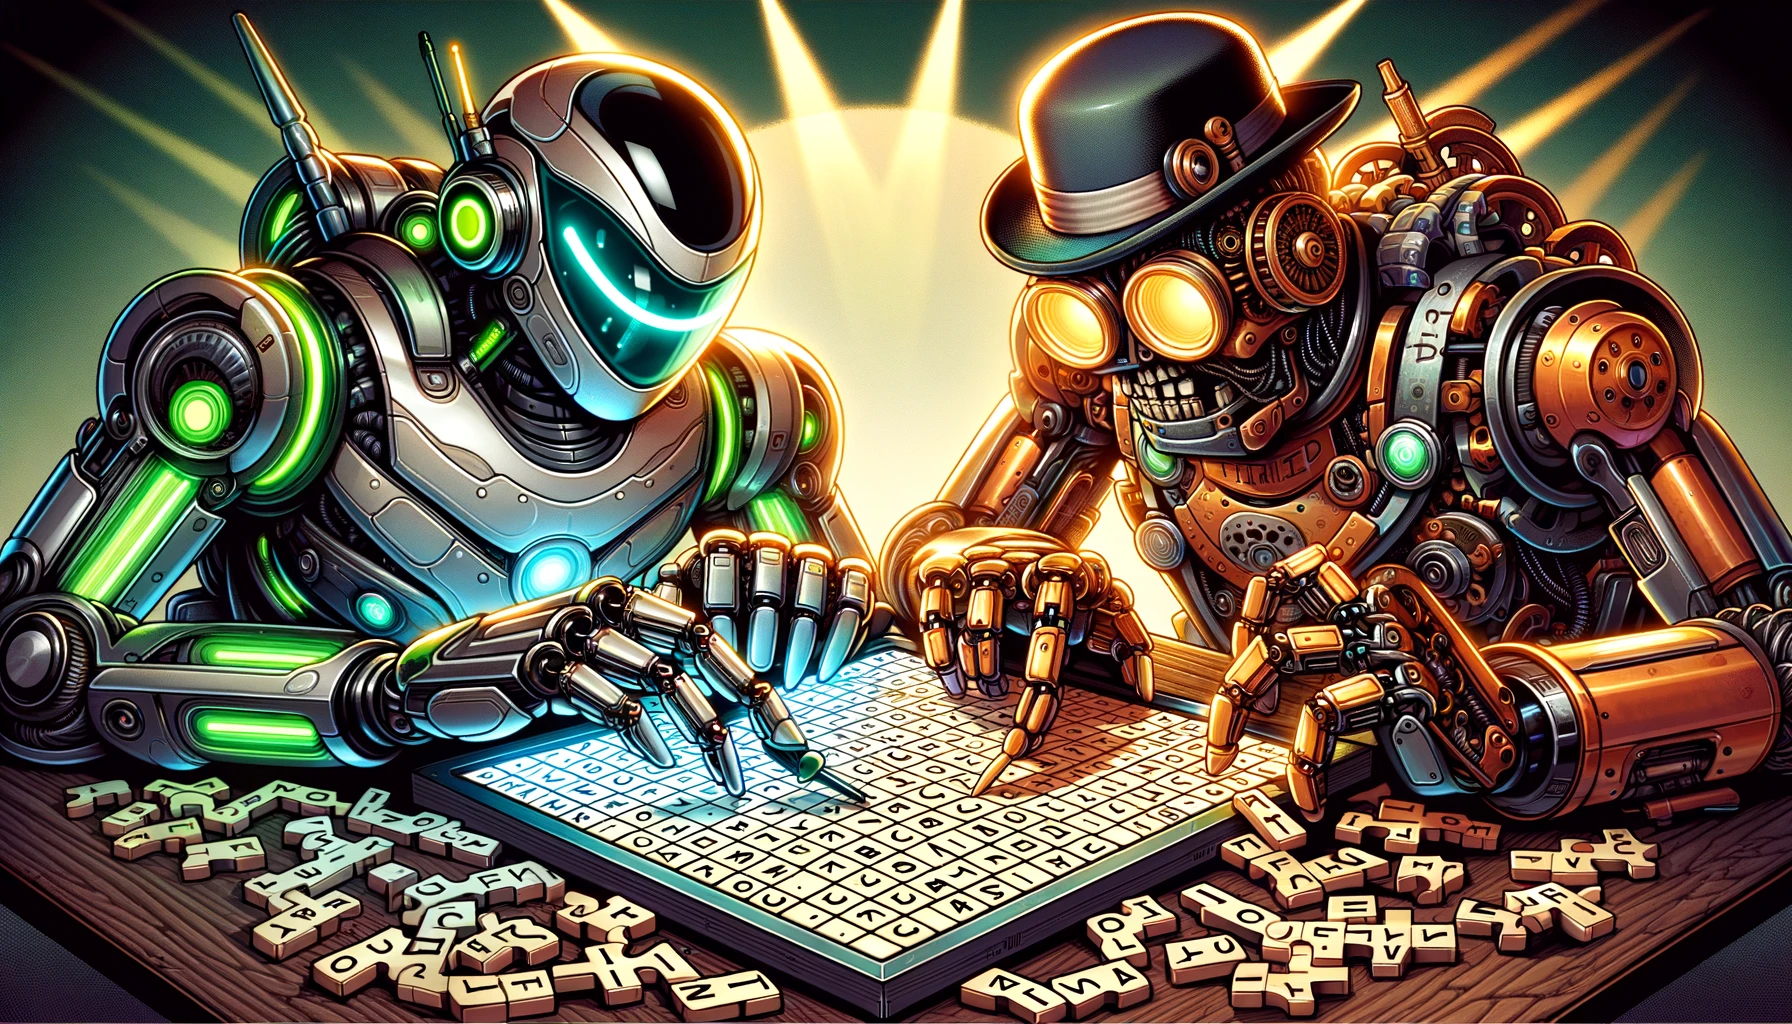
Short ZXQ words for Bananagrams